Call Sales: +1 (833) 437-3835
Call Sales: +1 (833) 437-3835
Revel | February 13, 2018 |
Every hour you’re open for business, your Point of Sale is busy accepting payments, calculating change, estimating tips, and a range of other transactions. That’s a lot of number crunching, and fortunately for you, the numbers don’t have to disappear unaccounted for.
The insights derived from your Management Console can take the guesswork out of running a business. Set yourself up for success with one of our most popular reporting tools, the Product Mix and Sales Summary report.
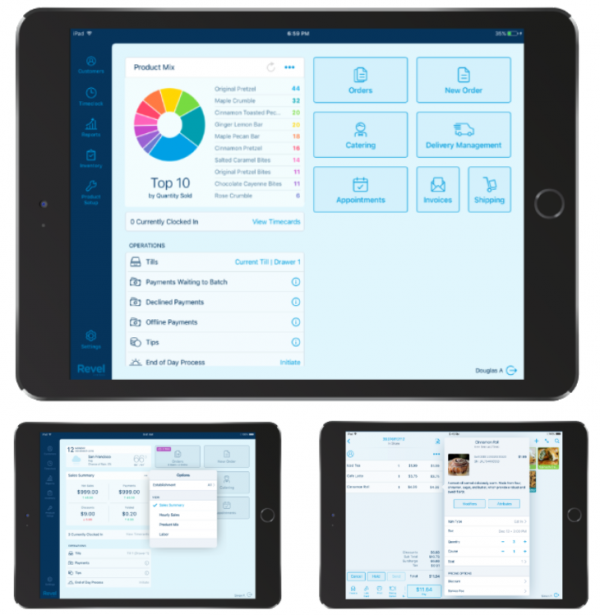
The Product Mix Report shows the breakdown each of your product's sales. It is a powerful tool that provides you insight into your best selling and most profitable items. This assists you in making inventory and menu decisions to keep your offerings fresh and ensure that what you're selling is making you money.

Reading the Graphs
You can filter your product mix report to show you (1) the top 10 profit by products. This is based on product cost and product price. You must have product costs entered for your items in order for this graph to display. And (2) top 10 quantity sold, which shows your top ten most sold items, and it’s a great way to quickly gauge what’s popular at your business!
Customize Your Report
Customize your report with the information that makes sense for your business. This enables you to get a very detailed picture of the successes and weaknesses in your products and offerings. By clicking the ‘Preferences’ button you can sort preferences, filter the fields you want displayed, adjust the quantity that displays next to each product, select the sales data you'd like to view, add in discount, margin, and pricing columns, and choose various taxing options. Check out the full list of preferences!

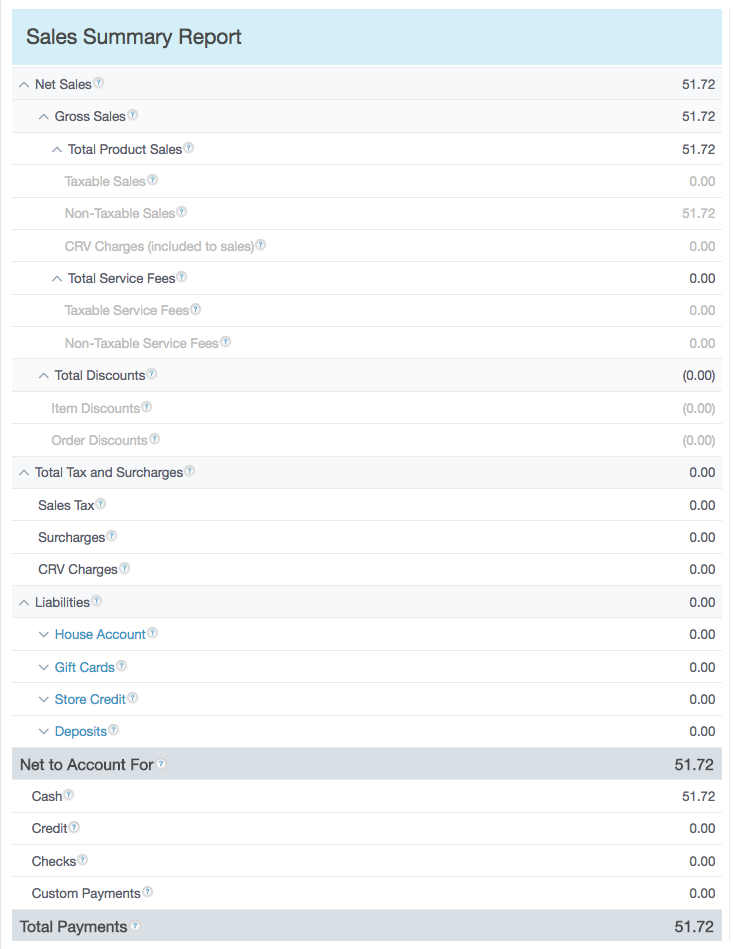
The Sales Summary Report provides detailed insight from daily sales, including fees, discounts, taxes, liabilities, and payments. This is a great way to uncover historical sales trends for your restaurant or store and further refine your merchandising strategy. This tool includes a global breakdown of all financial payments and transactions.
Reading the Graph
The graph at the top of the report displays the sales for any selected time range (click date on top left side of header to select range). Once selected, you will see that each bar signifies a particular day and hover over a bar to see the date along with the Net To Account For amount.
Customize Your Report
From here you can see sales determined in a number of different ways, for example, net sales, gross sales, total product sales, taxable and nontaxable sales, total service fees, total discounts, and many more.
An important part of the sales summary is tracking your liabilities. This includes, both activities that increase liabilities (including the sale of gift cards or the taking of a deposit on an invoice) and activities that decrease liabilities (including the use of gift cards or payments against house accounts).
Sales Analytics
These analytics are important to seeing and understanding the various trends affecting your sales. You can see your total transactions during a set period, number of invoices during a set period, and average sales per order.
Additionally, you can get a breakdown of all the different types of tips, credit payments both captured and declines, till transactions, cash due, as well as a number of different adjustments like returned items and refunds. Check out the full list here.
With Revel's suite of reporting tools you can make data-driven decisions and take the guesswork out of running a business. Check out our list of all our reports (and how to use them) here! Did you know our 2.34 update is underway? Check out the hottest features and full release notes.